

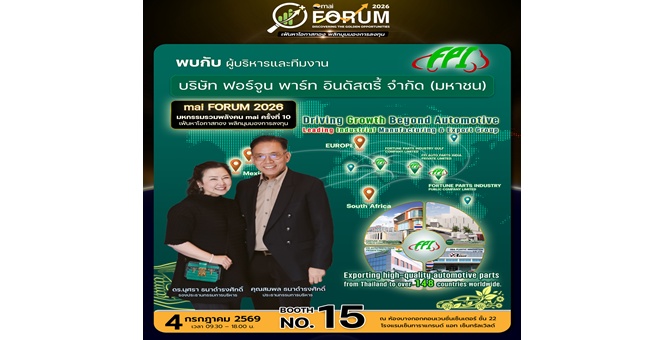
FPI FORTUNE PARTS INDUSTRY PUBLIC COMPANY LIMITED
FPI1.52
+0.02 (+1.33%)
High1.52
Low1.49
Total Vol537,100
Total Val(K)807.00
Overview
- SymbolFPI
- Market Cap (M.Bath)2,269.54
- IPO Date20 Sept 2012
- IPO Price3.50 @Par Value 1.00 Baht
- MANAGING DIRECTORMr. SOMPOL TANADUMRONGSAK
- Employees-
- IndustryINDUS-M
- Sector-
- IndexMAI
- SET ESG RatingsAAA
สรุปภาพรวมตลาด
FORTUNE PARTS INDUSTRY PUBLIC COMPANY LIMITED
Websitehttp://www.fpiautoparts.com
Address11/22 Moo 20 Nimitmai Road, Lamlukka Pathum Thani 12150
Telephone0-2993-4970-7
Fax0-2993-4978-9
Detail of Security
MarketMAI
First Trade Date20 Sept 2012
IndustryINDUS-M
Sector-
Foreign Limit (%)20.00 (Date 30 Jun 2026)
Foreign Ownership Limit Remaining (shares)285,757,384
Free Float (%)32.44
Par Value0.25
ISIN Number
Local : TH3786010Z01
Foreign : TH3786010Z19
NVDR : TH3786010R19
Dividend PolicyNot less than 30% of net profit after deduction of corporate income tax and legal reserve (with additional conditions)
Fiscal End31 Dec 2026
The person supervising accountingMiss Nachayada Sanomnao (Start Date 16 Aug 2022)
The person taking the highest responsibility in finance and accountingMr. Chusak Funilkul (Start Date 1 Mar 2023)
Capital Detail
Common Stock
Authorized Capital378,257,483.5
Paid-up Capital378,257,483.5
Preferred Shares
Authorized Capital-
Paid-up Capital-
Shares Detail
Common Stock
Listed Shares1,513,029,934
Paid-up Stock1,513,029,934Voting Right Ratio 1:1
Treasury Stock - : - - : -
Voting Stock minus Treasury Stock 30 Jun 2026 : 1,513,029,934 1 Jul 2026 : 1,513,029,934
Preferred Shares
Listed Shares-
Paid-up Stock-Voting Right Ratio -
Treasury Stock - : - - : -
Voting Stock minus Treasury Stock - : - - : -
Key Issues
Upcoming Event
 No data found
ข้อมูลบริษัทโดยสรุป
- SymbolFPI
- Market Cap (M.Bath)2,269.54
- IPO Date20 Sept 2012
- IPO Price3.50 @Par Value 1.00 Baht
- MANAGING DIRECTORMr. SOMPOL TANADUMRONGSAK
- Employees-
- IndustryINDUS-M
- Sector-
- IndexMAI
- SET ESG RatingsAAA
Related News & Article


Note
- Calculated using adjusted prices.
- Data is shown and calculated based on consolidated financial statements, presented as year-to-date quarterly figures. (If consolidated statements are unavailable, company-only statements are used.)
- Financial data is updated quarterly within 7 business days after new statements are released.
- Financial statement data reflects what listed companies submit for each period. Users should review the full financial statements for details, as some companies may revise comparative figures in the latest full version.
- The list of companies included in the SETESG Index is announced together with other indices, based on the latest SET ESG Ratings results. Source: www.set.or.th (Copyright @ The Stock Exchange of Thailand).