

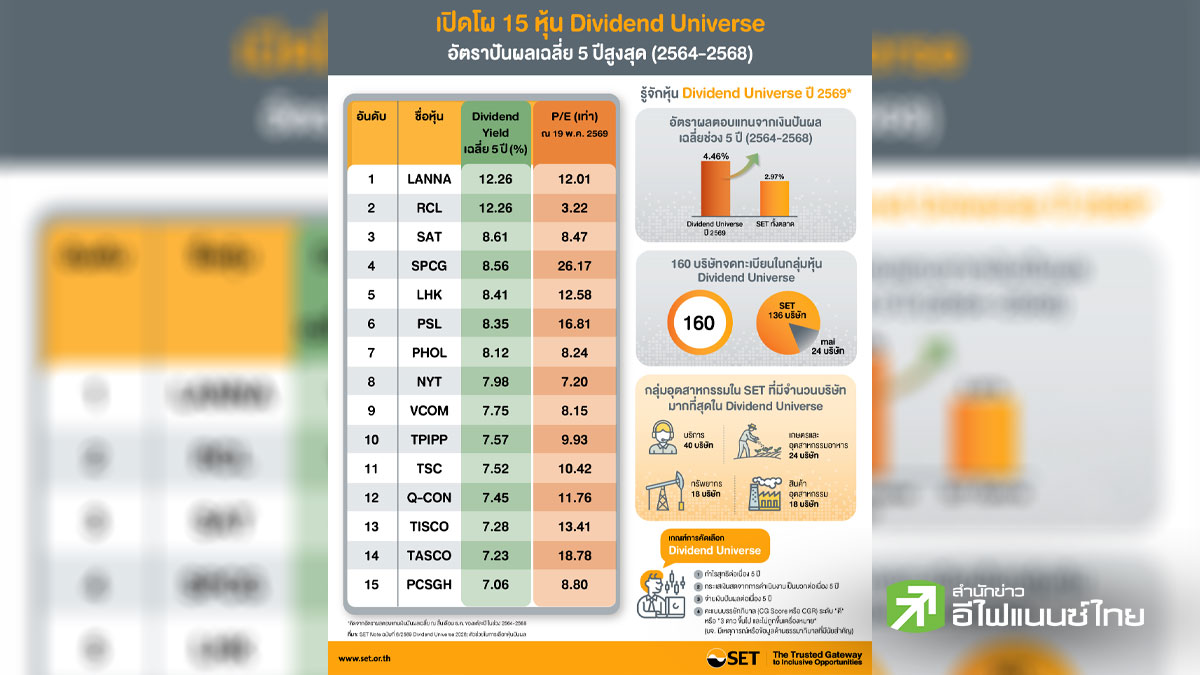
RCL บริษัท อาร์ ซี แอล จำกัด (มหาชน)
RCL30.75
+0.25 (+0.82%)
High30.75
Low30.25
Total Vol857,000
Total Val(K)26,164.00
ภาพรวมช่วงนี้
- SymbolRCL
- Market Cap (M.Bath)25,276.88
- IPO Date9 ธ.ค. 2531
- IPO Price180.00 @พาร์ 10.00 บาท
- PRESIDENTนาย ทวินโชค ตันธุวนิตย์
- Employees-
- Industryบริการ
- Sectorขนส่งและโลจิสติกส์
- IndexSET100FF, SETWB, SETCLMV, SETHD, SET100
- SET ESG Ratings-
สรุปภาพรวมตลาด
ข้อมูลย้อนหลัง 6 เดือน
วันที่ | ราคาเปิด | ราคาสูงสุด | ราคาต่ำสุด | ราคาปิด | เปลี่ยนแปลง | เปลี่ยนแปลง (%) | ปริมาณ ('000 หุ้น) | มูลค่า (ล้านบาท) | SET Index | เปลี่ยนแปลง (%) |
|---|---|---|---|---|---|---|---|---|---|---|
27 พ.ค. 2569 | 30.25 | 30.75 | 30.25 | 30.50 | +0.25 | +0.83 | 1,701.53 | 51.88 | 1,570.95 | +1.13 |
26 พ.ค. 2569 | 30.25 | 30.75 | 30.25 | 30.25 | 0.00 | 0.00 | 938.47 | 28.60 | 1,553.36 | +0.20 |
25 พ.ค. 2569 | 30.50 | 31.00 | 30.25 | 30.25 | -0.25 | -0.82 | 2,363.90 | 72.21 | 1,550.33 | +0.76 |
22 พ.ค. 2569 | 30.50 | 30.50 | 30.25 | 30.50 | 0.00 | 0.00 | 588.45 | 17.89 | 1,538.67 | +0.39 |
21 พ.ค. 2569 | 30.50 | 30.75 | 30.25 | 30.50 | 0.00 | 0.00 | 1,421.59 | 43.35 | 1,532.67 | +0.28 |
20 พ.ค. 2569 | 30.25 | 30.50 | 30.00 | 30.50 | +0.25 | +0.83 | 1,080.81 | 32.67 | 1,528.43 | +0.77 |
19 พ.ค. 2569 | 30.50 | 30.50 | 30.00 | 30.25 | -0.25 | -0.82 | 3,528.87 | 106.50 | 1,516.69 | -0.07 |
18 พ.ค. 2569 | 31.00 | 31.00 | 30.25 | 30.50 | -0.50 | -1.61 | 2,704.63 | 82.80 | 1,517.74 | -0.01 |
15 พ.ค. 2569 | 31.50 | 31.75 | 30.75 | 31.00 | -0.50 | -1.59 | 2,044.79 | 63.71 | 1,517.95 | -1.38 |
14 พ.ค. 2569 | 31.00 | 32.00 | 30.25 | 31.50 | +0.50 | +1.61 | 4,497.95 | 140.66 | 1,539.12 | +1.44 |
13 พ.ค. 2569 | 31.75 | 31.75 | 30.50 | 31.00 | -0.50 | -1.59 | 4,752.49 | 147.11 | 1,517.26 | +2.27 |
12 พ.ค. 2569 | 32.75 | 32.75 | 31.50 | 31.50 | -1.00 | -3.08 | 3,472.66 | 111.47 | 1,483.56 | -0.38 |
11 พ.ค. 2569 | 32.00 | 32.75 | 32.00 | 32.50 | +0.50 | +1.56 | 4,787.23 | 155.02 | 1,489.29 | -0.74 |
8 พ.ค. 2569 | 32.00 | 32.75 | 31.75 | 32.00 | -0.25 | -0.78 | 3,449.87 | 111.23 | 1,500.36 | -0.48 |
7 พ.ค. 2569 | 32.75 | 32.75 | 31.75 | 32.25 | -0.25 | -0.77 | 2,696.91 | 86.64 | 1,507.53 | -0.62 |
6 พ.ค. 2569 | 31.00 | 32.75 | 31.00 | 32.50 | +1.75 | +5.69 | 7,780.25 | 249.91 | 1,516.91 | +1.80 |
5 พ.ค. 2569 | 31.00 | 31.00 | 30.50 | 30.75 | 0.00 | 0.00 | 1,199.30 | 36.83 | 1,490.10 | -0.24 |
30 เม.ย. 2569 | 30.50 | 31.25 | 30.50 | 30.75 | +0.25 | +0.82 | 2,726.49 | 84.20 | 1,493.69 | +0.13 |
29 เม.ย. 2569 | 30.00 | 30.75 | 29.50 | 30.50 | +0.50 | +1.67 | 5,215.40 | 157.57 | 1,491.74 | +0.78 |
28 เม.ย. 2569 | 30.00 | 30.00 | 29.75 | 30.00 | 0.00 | 0.00 | 1,120.02 | 33.44 | 1,480.20 | +0.07 |
แสดง
20
รายการ จาก
-
ทั้งหมด 116 รายการ
หมายเหตุ
ปริมาณ / มูลค่าการซื้อขายรวมจากทุกวิธีการซื้อขาย (Auto Matching, Trade Report และ Odd Lot)
ATO คือ คำสั่งซื้อหรือขายหลักทรัพย์ ณ ราคาเปิดตลาด
ATC คือ คำสั่งซื้อหรือขายหลักทรัพย์ ณ ราคาปิดตลาด
ข้อมูลเพื่อการศึกษาหรือใช้งานส่วนบุคคลเท่านั้น ไม่ใช่เพื่อประกอบการซื้อขายหลักทรัพย์
ประเด็นสำคัญในการลงทุน
กิจกรรมที่กำลังจะมาถึง
 ไม่พบข้อมูล

ข้อมูลบริษัทโดยสรุป
- SymbolRCL
- Market Cap (M.Bath)25,276.88
- IPO Date9 ธ.ค. 2531
- IPO Price180.00 @พาร์ 10.00 บาท
- PRESIDENTนาย ทวินโชค ตันธุวนิตย์
- Employees-
- Industryบริการ
- Sectorขนส่งและโลจิสติกส์
- IndexSET100FF, SETWB, SETCLMV, SETHD, SET100
- SET ESG Ratings-


หมายเหตุ
- คำนวณจากราคาที่ปรับฐานแล้ว (Adjusted price)
- แสดงข้อมูลและคำนวณข้อมูลจากงบรวม และแสดงข้อมูลเป็นงบไตรมาสสะสมตามปีงบการเงิน(กรณีไม่มีงบรวม จะแสดงข้อมูลและคำนวณข้อมูลจากงบบริษัท)
- ข้อมูลจะเปลี่ยนแปลงทุกไตรมาสภายใน 7 วันทำการ หลังจากมีงบการเงินใหม่เข้ามา
- ข้อมูลงบการเงิน เป็นข้อมูลตามที่บริษัทจดทะเบียนนำส่ง ณ งวดนั้นๆ ผู้ใช้ข้อมูลควรศึกษารายละเอียดเพิ่มเติมจากงบการเงินฉบับเต็มประกอบ ซึ่งมีบางบริษัทอาจมีการปรับปรุงงบที่แสดงเปรียบเทียบในงบฉบับเต็มงวดล่าสุด
- รายชื่อบริษัทที่เป็นองค์ประกอบของ SETESG Index จะประกาศพร้อมกับดัชนี้อื่นๆ โดยใช้ข้อมูลจากผลประเมินหุ้นยั่งยืน SET ESG Ratings ที่ประกาศล่าสุด ที่มา : www.set.or.th (สงวนลิขสิทธิ์โดย ตลาดหลักทรัพย์แห่งประเทศไทย)